What menu engineering is
It is a method for analysing a menu, published by Michael Kasavana and Donald Smith in 1982. Rather than looking only at what sells most, it sets each dish's popularity against what each sale makes you. A dish that sells a lot on a thin margin can earn you less than one that sells less on a healthy margin.
It works one section at a time: starters with starters, mains with mains, desserts with desserts. Comparing a dessert with a steak tells you nothing, because they compete for different things. You will also see ploughhorses spelt "plowhorses", as in the original American terms.
The data you need
- Units sold of each dish over a representative period, such as a month, without unusual weeks (bank holidays, promotions, closures).
- Selling price excluding VAT: VAT isn't yours, so it isn't margin.
- The food cost of each dish: what the ingredients for one portion cost, from the standard recipe or dish spec. If you don't have it, that is your first job.
- If a dish is sold on a promotion or a set menu at another price, use the price you actually charge.
Step 1: popularity
Work out each dish's share of its section's sales, known as the sales mix: units of the dish ÷ units of the whole section. If every dish sold equally, each would have 1/n, where n is the number of dishes in the section.
A dish is popular if its share is at least 70% of 1/n. With six dishes, 1/6 is 16.7% and 70% of that is 11.7%: any dish reaching 11.7% of its section's sales counts as popular.
The 70% comes from the original method and stops a dish that sells slightly below the average from being labelled unpopular.
Step 2: contribution margin
A dish's contribution margin is selling price − food cost. It is what each portion leaves to pay wages, rent and every other cost, and to make a profit.
To tell whether a margin is high or low, compare it with the section's weighted average contribution margin: the sum of (margin × units sold) for every dish, divided by total units. A dish with a margin equal to or above that average has a high margin.
Weighting matters: a simple average of the margins would treat a dish sold 10 times the same as one sold 300 times.
Step 3: the menu engineering matrix (four quadrants) and what to do with each
| Quadrant | Popularity | Margin | What to do |
|---|---|---|---|
| Star | High | High | Protect it: same recipe, same portion and a prominent spot. Never let it run out. It may take a small price rise. |
| Ploughhorse | High | Low | It sells itself but makes little. Raise the price gradually, look at the portion or the garnish to bring the cost down, or pair it with something higher-margin. Don't give it the best spot on the menu. |
| Puzzle | Low | High | A good margin, but few people order it. Give it visibility: a better position, a photo, a better name and description, and have staff recommend it. If it still doesn't move, check whether the price puts people off. |
| Dog | Low | Low | A candidate to come off the menu. If you keep it for a reason (it is the vegetarian option, or a house classic), raise the price or rework it so it earns more. |
A worked example with six dishes
A fictional example: the mains section of a pub over one month. Prices exclude VAT.
| Dish | Units | Sales mix | Price | Food cost | Margin | Total margin |
|---|---|---|---|---|---|---|
| Fish and chips | 230 | 23.0% | £13.50 | £4.20 | £9.30 | £2,139.00 |
| Steak and ale pie | 290 | 29.0% | £12.00 | £3.60 | £8.40 | £2,436.00 |
| Pan-roasted salmon | 100 | 10.0% | £16.50 | £6.00 | £10.50 | £1,050.00 |
| Classic burger | 200 | 20.0% | £11.00 | £3.40 | £7.60 | £1,520.00 |
| Wild mushroom risotto | 70 | 7.0% | £12.50 | £2.10 | £10.40 | £728.00 |
| Chicken Caesar salad | 110 | 11.0% | £10.00 | £4.30 | £5.70 | £627.00 |
| Total | 1,000 | 100% | £8,500.00 |
The two cut-offs:
- Popularity: 70% of 1/6 = 11.7%. The fish and chips (23%), the pie (29%) and the burger (20%) are popular. The Caesar salad (11%) falls just below the line.
- Margin: £8,500.00 ÷ 1,000 units = £8.50 weighted average margin. The fish and chips (£9.30), the salmon (£10.50) and the risotto (£10.40) have a high margin.
| Dish | Popularity | Margin | Quadrant |
|---|---|---|---|
| Fish and chips | High | High | Star |
| Steak and ale pie | High | Low | Ploughhorse |
| Classic burger | High | Low | Ploughhorse |
| Pan-roasted salmon | Low | High | Puzzle |
| Wild mushroom risotto | Low | High | Puzzle |
| Chicken Caesar salad | Low | Low | Dog |
Reading it: the pie is the best seller, but it makes 90p less per portion than the fish and chips and misses the average by just 10p. If you put its price up by 50p and it keeps selling the same, its margin becomes £8.90, the section average rises to about £8.65 and the pie becomes a star. The salmon and the risotto leave more than anything else but rarely get ordered, so work on their position, photo and description. The Caesar salad is the one to review: before you drop it, try a recipe or a price that improves its margin.
Download the menu engineering worksheet in Excel: it has this example and a sheet for up to 60 dishes that works out both cut-offs and each dish’s quadrant for you. Free, with no sign-up.
What ElMenu shows you
ElMenu doesn't handle recipes, food costs or stock, so you work out the contribution margin yourself, in a spreadsheet. What it does give you is another clue: on the Professional and Premium plans, Which dishes make you money compares how many times each dish is opened on your digital menu with how many units are ordered, if you take orders with the ElMenu kitchen display.
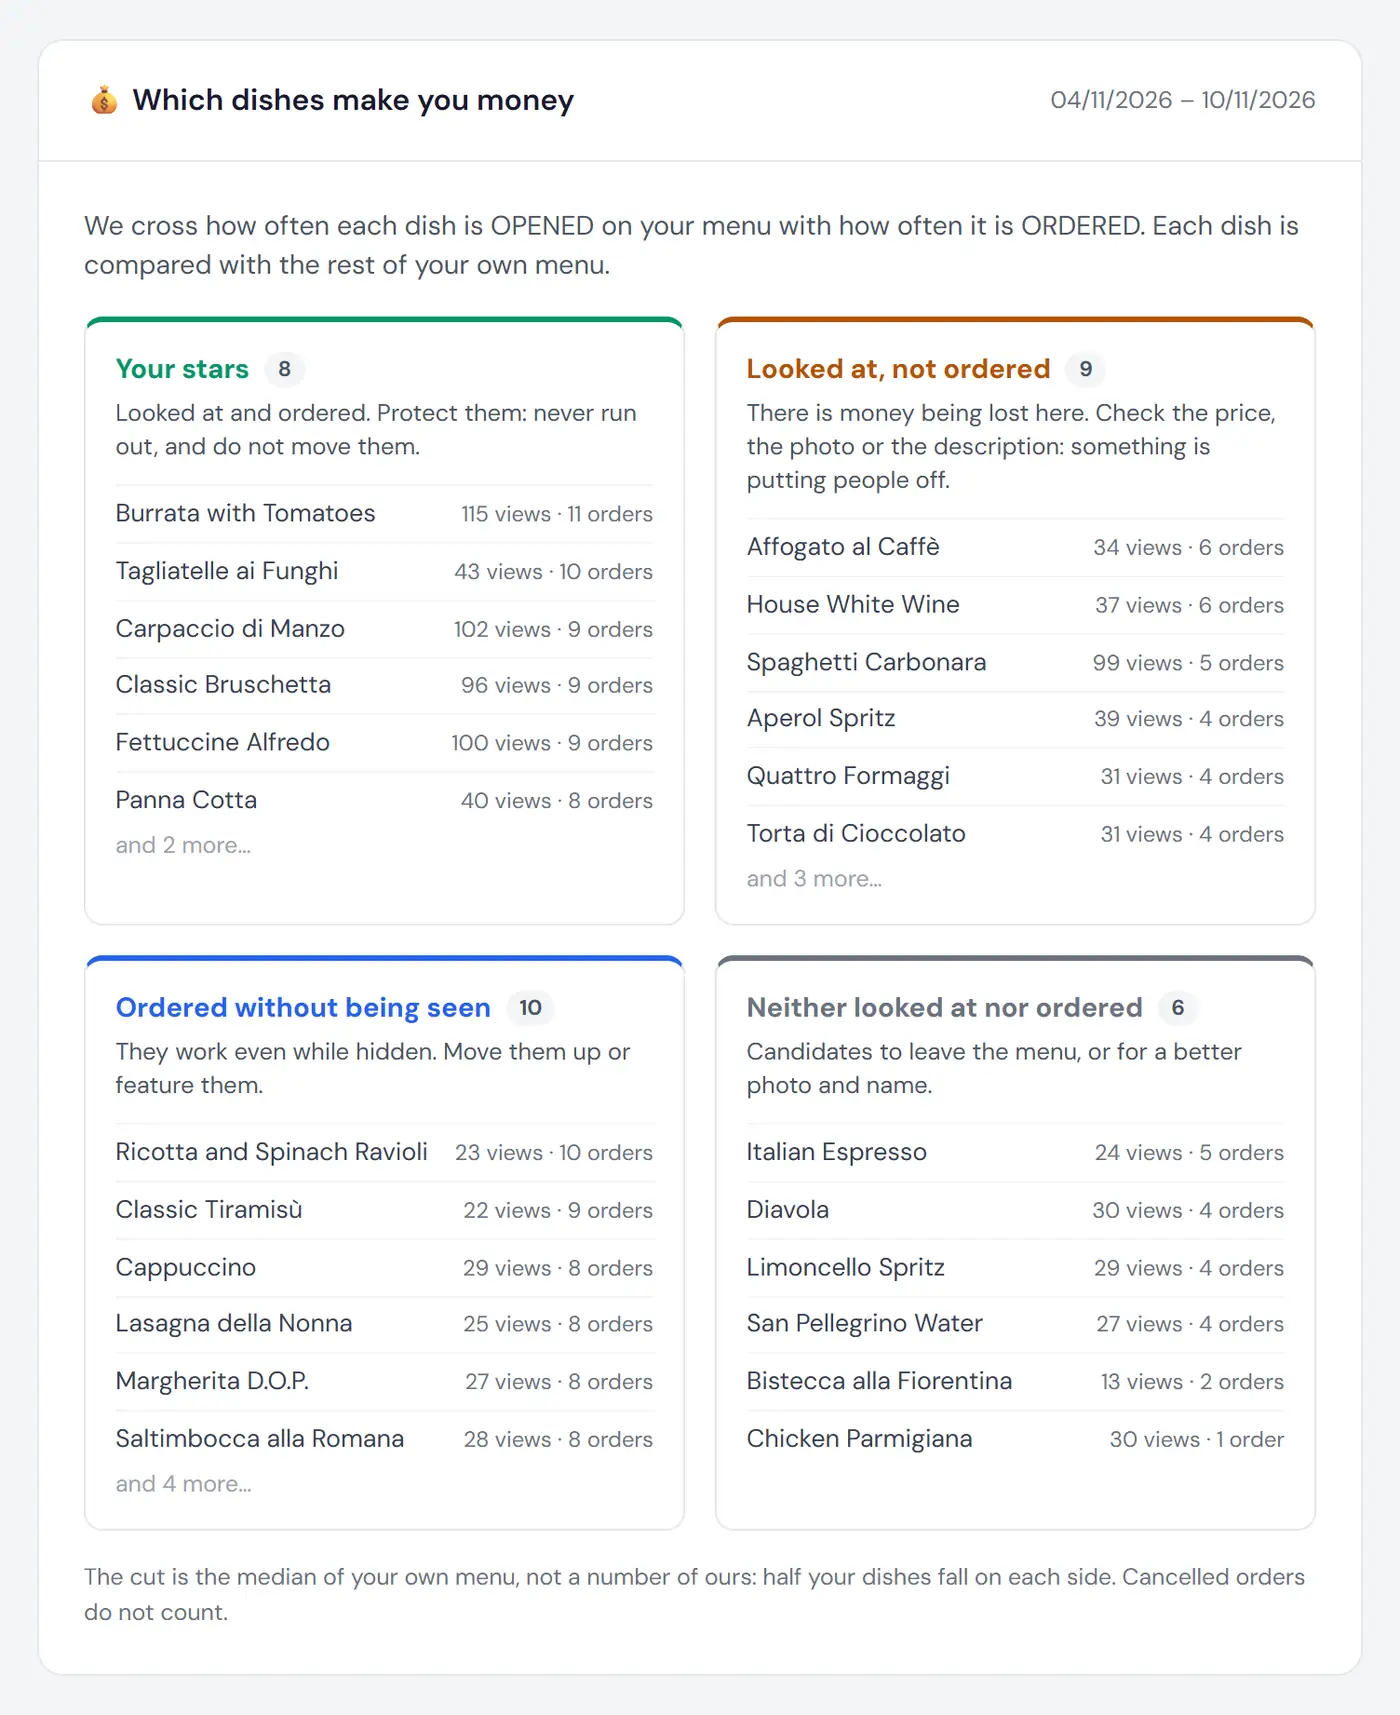
With that, it sorts your dishes into four groups: looked at and ordered, looked at but not ordered, ordered without being looked at, and neither. The cut-off is the median of your own menu, and cancelled orders don't count. Note that "stars" there means lots of views and lots of orders, not margin, so read it alongside your margin table.
That cross-check helps most with puzzles: if a dish is opened often but rarely ordered, something is holding the sale back (price, photo or description); if hardly anyone opens it, the problem is that nobody sees it. Changes to order, featured dishes, photos and descriptions show up instantly on your QR menu, and the printable menu from the menu maker follows the same order as your digital menu. See what each plan includes on our pricing page.